
| Version 12 (modified by , 12 years ago) ( diff ) |
|---|
Spectrum sensing with USRP2
Description
In this tutorial we'll use the USRPs on the grid for FFT-based spectrum sensing. Each USRP (centered on a frequency with specified bandwidth) will collect data into an OML server for post processing. For details on available USRP2s on the grid, please see available USRP2 HW.
Hardware / Software Resources utilized
- Grid nodes with a USRP2 connect via Ethernet.
- ubuntu-11-10-gnuradio.ndz: disk image loaded onto nodes. This image has all the precompiled - software required to configure the USRPs and analyze recorded data. The USRP2's interface with the node is already configured.
- spectrum: application on node to set up & collect data from USRP2 and send to OML server / local file for recording in database file.
- spectrum_console: application on console to configure & initiate spectrum sense application on node.
- Orbit's Arbitrary Waveform Injection System: used to inject noise or simple signal into RF environment. More information of this generator can be found here.
Set up
- To get started first make a reservation on the Orbit Scheduler for using the Grid.
- After logging into grid console, make sure all nodes are turned off
nilanjan@console.grid:~$ omf-5.3 tell -a offh -t system:topo:n210
- Verify state of node before continuing. Make sure all nodes are in the POWEROFF state.
nilanjan@console.grid:~$ omf-5.3 stat
- Image nodes
nilanjan@console.grid:~$ omf-5.3 load -i ubuntu-11-10-gnuradio.ndz -t system:topo:n210
- After nodes are imaged, verify that nodes are in POWEROFF state. Otherwise issue the following to turn them off for a reboot
nilanjan@console.grid:~$ omf-5.3 tell -a offh -t system:topo:n210
- Turn nodes back on and verify they are in POWERON state
nilanjan@console.grid:~$ omf-5.3 tell -a on -t system:topo:n210
- Before proceeding, download the spectrum console application code to your local directory. This is the application that will invoke the application to configure the USRP on the nodes.
nilanjan@console.grid:~/UHD/SPECTRUM/w$ wget http://www.orbit-lab.org/raw-attachment/wiki/Documentation/GNURadio/Tutorials/FFTSpectrum/spectrum_console.cpp
- Compile the application code.
nilanjan@console.grid:~/UHD/SPECTRUM/w$ g++ spectrum_console.cpp -lboost_program_options-mt -loml2 -o spectrum_console
Spectrum sensing with multiple nodes at different frequencies
- To view the available parameters for the console application
nilanjan@console.grid:~/UHD/SPECTRUM/w$ ./spectrum_console --help
- The first run will demonstrate how to use the sensing application on multiple nodes centered at different frequencies. In this case we will not inject noise into the environment. Check the following page to view nodes corresponding to usrp n210.
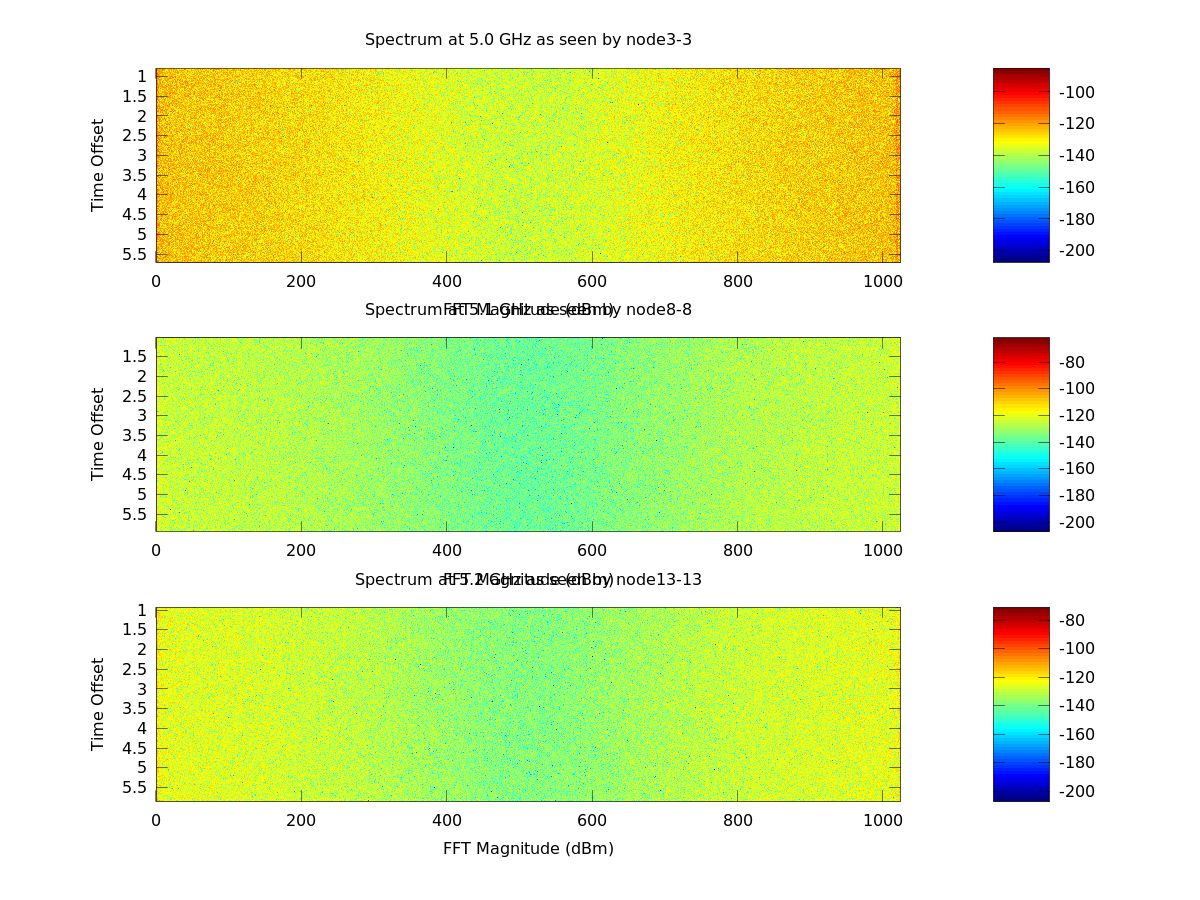
In this case we'll be sensing on node3-3, node8-8, node13-13 on the frequencies 5.0 GHz, 5.1 GHz, 5.2 GHz respectively.
Sampling rate option (—rate 8e6) yields a bandwidth of 4MHz.
The fft size (—num-bins 1024) corresponds to a 1024 point fft.
The time option (—time 5) runs the application for 5 seconds. Since the —oml file option is used the collected data will be store on the node locally.
nilanjan@console.grid:~/UHD/SPECTRUM/w$ ./spectrum_console --rate 8e6 --num-bins 1024 --time 5 --oml file --node node3-3,node8-8,node13-13 --freq 5.0e9,5.1e9,5.2e9
- The recorded spectrum data is stored in a file under the root directory on each of the nodes. Copy that data file from the node to the console and check the contents. Each node will have its own file: /root/spectrum_measurement_nodex-y.
The following will copy the data collect from node3-3 to the console.nilanjan@console.grid:~/UHD/SPECTRUM/w$ scp root@node8-8:/root/spectrum_measurement_node8-8 .
- The contents of the file is very long and is in a database format. The full contents of an example run can be view here.
- Plot of the noise floor at 5.0GHz, 5.1GHZ and 5.2 GHz is shown below.

|
Frequency detection with multiple nodes.
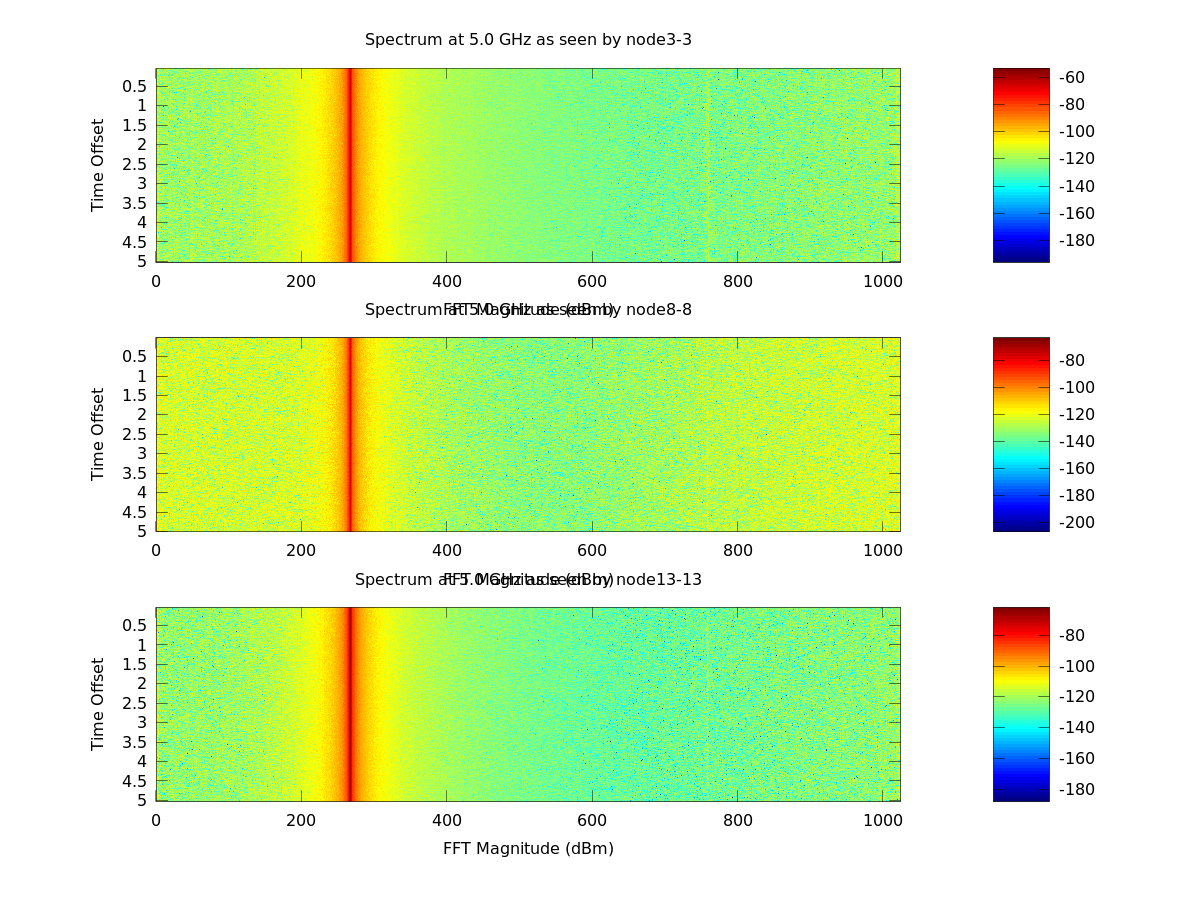
- This will demonstrate using the waveform generator to create a signal at 5.002 GHz and using the USRPs to detect & record the signal. From the grid console enter the following to configure & run the waveform generator at 5.002 GHz with a -1 dBm power level.
nilanjan@console.grid:~/UHD/SPECTRUM/w$ wget -qO- http://instrument1.orbit-lab.org:5012/interference/stop
OK
nilanjan@console.grid:~/UHD/SPECTRUM/w$ wget -qO- http://instrument1.orbit-lab.org:5012/interference/set?frequency=5.002\&power=-1
OK
nilanjan@console.grid:~/UHD/SPECTRUM/w$ wget -qO- http://instrument1.orbit-lab.org:5012/interference/start
OK
- Now use the node3-3, node8-8 and nod13-13 to record data at frequency 5.0 GHz with a sampling rate of 8e6.
nilanjan@console.grid:~/UHD/SPECTRUM/w$ ./spectrum_console --rate 8e6 --num-bins 1024 --time 5 --oml file --node node3-3,node8-8,node13-13 --freq 5.0e9
- After the application as completed turn off the waveform generator.
nilanjan@console.grid:~/UHD/SPECTRUM/w$ wget -qO- http://instrument1.orbit-lab.org:5012/interference/stop
OK
- As before each node will have it owns data file. At zip file with this data can be downloaded here.
- The extracted data and plot of the signal detection is shown below.

|
Attachments (11)
- spectrum_measurement_node8-8 (24.6 MB ) - added by 12 years ago.
- noise_floor.png (715.4 KB ) - added by 12 years ago.
- f5.002.png (659.3 KB ) - added by 12 years ago.
- spectrum_console.cpp (5.4 KB ) - added by 12 years ago.
- CWriteOML_spectrum.h (5.2 KB ) - added by 12 years ago.
- spectrum.cpp (9.9 KB ) - added by 12 years ago.
- s1.png (44.8 KB ) - added by 9 years ago.
- s2.png (44.9 KB ) - added by 9 years ago.
- signal.png (204.0 KB ) - added by 9 years ago.
- fReconFDSignal.m (240 bytes ) - added by 9 years ago.
- readWiserdFile.m (675 bytes ) - added by 9 years ago.
Note:
See TracWiki
for help on using the wiki.